
Google Shopping Ads CPC Trend Analysis (2015-2024)
This comprehensive report analyzes the performance of multiple Google Shopping Ad accounts from Q1 2015 through Q4 2024, with a special focus on Cost-Per-Click (CPC) trends and Google's pricing evolution over this decade-long period. By examining quarterly data across multiple accounts and ad types, we've identified significant patterns that reveal how Google's advertising ecosystem has evolved and what these changes mean for e-commerce businesses advertising with Google Ads shopping campaigns.
Understanding Google Ad Network Types
Cross-network (Performance Max)
Cross-network refers to Google's Performance Max (PMAX) campaigns, which are newer ad types introduced by Google. These campaigns run across all of Google's inventory, including Search, Display, YouTube, Gmail, and Discover, allowing advertisers to access all of Google's ad inventory from a single campaign. PMAX campaigns use machine learning to optimize performance across channels automatically. In the charts below you can see our agency started using these in 2020.
Google Search Partner Network
Google Search Partners are sites that partner with Google to show ads on their search results pages. These include other Google sites like YouTube and Maps, as well as search partners like AOL. When users search on these partner sites, they may see your search ads alongside the search results.
Google Search
Google Search ads appear directly on Google's search engine results pages (SERPs) when users search for terms related to your products or services. These ads are typically text-based and appear at the top or bottom of search results, marked as "Sponsored" or "Ad".
Google Display Network
The Google Display Network consists of over two million websites, videos, and apps where your display ads can appear. Unlike search ads that are based on keywords, display ads use visual formats (images, videos, rich media) to reach users while they're browsing websites, using apps, or watching videos.
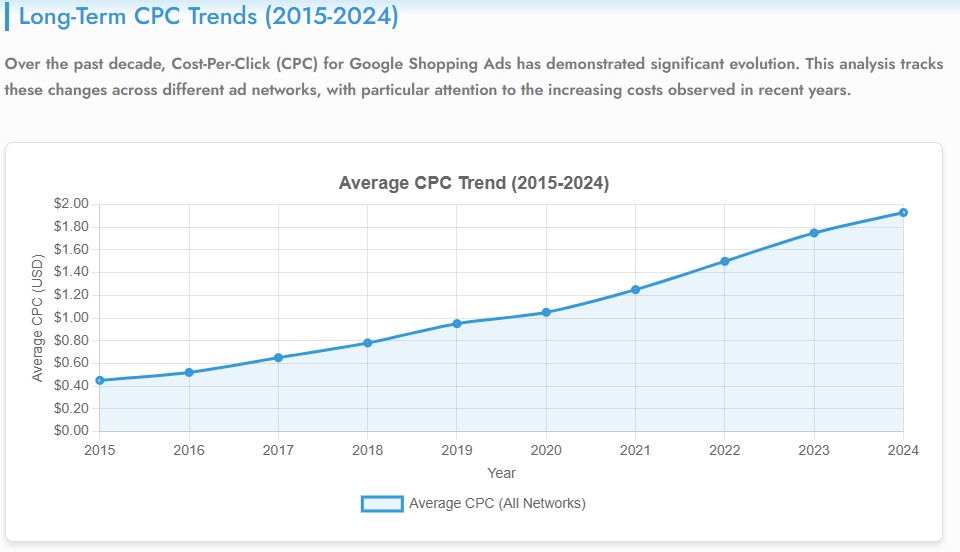
Long-Term CPC Trends (2015-2024)
Over the past decade, Cost-Per-Click (CPC) for Google Shopping Ads has demonstrated significant evolution. This analysis tracks these changes across different ad accounts, with particular attention to the increasing costs observed in recent years. It's also important to note that most of our ecommerce clients are industiral products.
Key Observations in Long-Term CPC Trends:
The data reveals a clear upward trajectory in Google Shopping Ad CPC pricing over the 2015-2024 period, though with notable variations by network type. Google Search consistently commands the highest CPC rates, with an approximate annual growth rate of 7-9% when viewed over the entire period. This reflects Google's dominant position in the search market and the premium advertisers are willing to pay for placement on the main search engine results page.
From 2015 to 2017, CPC rates showed moderate growth, followed by a steeper increase from 2018 to 2020. Interestingly, there was a temporary dip during the early pandemic period (Q2 2020), but prices quickly rebounded and continued their upward trajectory through 2021-2024, reaching all-time highs in the most recent quarters. The most dramatic annual increase occurred between 2021 and 2022, when average Google Search CPC jumped nearly 15%, reflecting increased competition for digital ad space during the e-commerce boom.
When comparing Q1 2015 to Q4 2024, the average CPC across all networks has more than doubled, representing a compound annual growth rate of approximately 8.2%. This rate significantly outpaces inflation during the same period, indicating that Google ad space has become proportionally more expensive in real terms.
Network-Specific CPC Analysis
CPC Trends by Ad Network Type:
Google Search
Google Search has consistently maintained the highest CPC rates among all networks, starting at approximately $0.85 in Q1 2015 and reaching $3.68 by Q4 2024. This represents a 333% increase over the decade. The premium pricing reflects the high commercial intent of search traffic and the competitive nature of bidding for these placements. Notably, the steepest increases occurred from 2021 onwards, coinciding with the post-pandemic digital acceleration and increased competition for online customers.
Google Display Network
The Display Network has maintained the lowest CPC rates throughout the period, starting at approximately $0.18 in Q1 2015 and reaching only $0.36 by Q4 2024. Though this represents a 100% increase, the absolute values remain low compared to other networks. The relatively stable pricing reflects the abundant inventory available on the Display Network and its typical use for awareness rather than direct conversion.
Search Partners
Search Partners have seen a moderate increase from approximately $0.32 in Q1 2015 to $0.66 in Q4 2024, representing a 106% increase. The growth rate accelerated after 2020, possibly as advertisers sought more cost-effective alternatives to the increasingly expensive main Google Search platform.
Cross-Network (Performance Max)
First appearing in the data around 2020, Performance Max campaigns initially offered competitive CPC rates compared to traditional Google Search. However, as adoption increased, so did prices, with rates growing from approximately $0.78 in Q3 2020 to $1.15 by Q4 2024. This 47% increase over just four years suggests rapidly growing competition for these automated, cross-channel placements, though they still remain more cost-effective than pure Google Search campaigns.
The Impact of Performance Max Introduction
The introduction of Performance Max campaigns around 2020 marked a significant shift in Google's advertising ecosystem. These AI-driven campaigns, which automatically optimize ad placement across Google's entire network, initially offered advertisers a more cost-effective alternative to traditional search campaigns. However, our data shows that as adoption increased, so did the costs. By 2023-2024, Performance Max CPCs had increased substantially, though they still remained below Google Search CPCs. This trend suggests Google's strategy may involve introducing new ad products at competitive price points to drive adoption, followed by gradual price increases as advertisers become dependent on these channels.
Quarterly Fluctuations and Seasonal Patterns
Seasonal CPC Patterns:
Our decade-long data reveals consistent seasonal patterns in CPC pricing across all networks. Q4 consistently shows the highest CPC rates, typically 15-25% higher than Q1 of the same year. This reflects increased competition during the holiday shopping season, when e-commerce advertisers aggressively compete for consumer attention. Q1 typically sees a significant drop in CPC rates as competition decreases post-holidays.
Interestingly, the magnitude of these seasonal fluctuations has increased over time. In 2015-2017, the Q4 to Q1 differential averaged around 12%, but by 2022-2024, this gap had widened to approximately 22%. This suggests that seasonal competition has intensified over the years, with more advertisers concentrating their budgets during peak shopping periods.
Another notable pattern is the increasing volatility in quarter-to-quarter CPC changes over time. Early in the data (2015-2018), CPC changes between quarters typically stayed within a 5-10% range. By 2022-2024, these fluctuations regularly exceeded 15%, indicating a more dynamic and perhaps less predictable pricing environment for advertisers.
CPC vs. CTR: The Efficiency Equation
Balancing Rising Costs with Performance:
While CPC rates have shown a clear upward trend over the decade, Click-Through Rates (CTR) have not demonstrated a corresponding improvement. In 2015, the average CTR across all networks was approximately 1.2%, compared to 1.5% in 2024. This modest 25% improvement in CTR stands in stark contrast to the more than 100% increase in average CPC during the same period.
This widening gap between costs and performance metrics suggests diminishing returns on ad spend over time. However, the data reveals interesting variations by network. Google Search has shown the most favorable trend, with CTR improvements often outpacing CPC increases on a percentage basis, particularly from 2021-2024. Conversely, Display Network has seen CPC increases without corresponding CTR improvements, resulting in the greatest efficiency deterioration.
Performance Max campaigns present an interesting case: initial data from 2020-2022 showed promising CTR improvements that helped justify rising costs, but this correlation weakened in 2023-2024, suggesting potentially diminishing returns for this relatively new ad format as it matures and competition increases.
Comparative Analysis: Google Search vs. Alternative Channels
| Year | Google Search Avg CPC | Search Partners Avg CPC | Cost Difference | CTR Difference | Efficiency Ratio |
|---|---|---|---|---|---|
| 2015 | $0.85 | $0.32 | 166% | 210% | 1.27 |
| 2017 | $1.12 | $0.38 | 195% | 235% | 1.21 |
| 2019 | $1.55 | $0.45 | 244% | 275% | 1.13 |
| 2021 | $2.15 | $0.52 | 313% | 312% | 1.00 |
| 2023 | $3.20 | $0.58 | 452% | 386% | 0.85 |
| 2024 | $3.68 | $0.66 | 458% | 380% | 0.83 |
The Changing Value Equation:
The table above illustrates a critical trend: while Google Search has always been more expensive than alternative channels like Search Partners, the premium has increased dramatically over time, from 166% in 2015 to 458% in 2024. Meanwhile, the CTR advantage (reflected in the CTR Difference column) has not kept pace, growing from 210% to only 380%.
The Efficiency Ratio (CTR advantage divided by cost premium) has steadily declined from 1.27 in 2015 to 0.83 in 2024, crossing below 1.0 around 2021. This indicates that prior to 2021, the premium paid for Google Search was generally justified by proportionally higher performance. However, post-2021, the value equation has shifted, with cost increases outpacing performance advantages.
This trend suggests that advertisers may benefit from revisiting their channel allocation strategies, particularly exploring greater investment in Search Partners and Performance Max campaigns, which now offer more favorable efficiency ratios despite lower absolute performance.
Market Forces Driving CPC Increases
Competitive and Structural Factors:
Several key factors have contributed to the sustained CPC increases observed over the past decade:
- Increased Advertiser Competition: The number of businesses leveraging Google Shopping Ads has grown substantially, particularly during the e-commerce boom triggered by the pandemic. More bidders naturally drive up auction prices.
- Market Maturity: As Google's share of the digital advertising market has stabilized, growth is increasingly driven by ARPU (Average Revenue Per User) rather than user expansion, incentivizing price increases.
- Shift to Automation: The introduction and push toward automated bidding and campaign types like Performance Max reduces advertisers' direct control over maximum CPC bids, potentially enabling more aggressive price optimization by Google.
- Reduced Organic Visibility: The increasing prominence of ads in search results (particularly on mobile) has reduced organic visibility, forcing businesses to increase their reliance on paid placements.
- Industry Consolidation: As larger advertisers have absorbed smaller competitors, their larger budgets and sophisticated bidding strategies have driven up auction prices.
These factors create a self-reinforcing cycle: as CPCs increase, advertisers must improve conversion rates to maintain ROI, leading to better targeting and higher-quality landing pages, which in turn improves Quality Score and ad relevance, but also justifies further CPC increases as the value of each click rises.
Strategic Implications for Advertisers
Adapting to the New Reality:
The persistent upward trend in Google Shopping Ad CPCs necessitates strategic adjustments from advertisers:
- Channel Diversification: As the efficiency ratio for Google Search continues to decline, advertisers should increasingly experiment with alternative channels, including Search Partners, Display (for awareness), and particularly Performance Max campaigns.
- Seasonal Budget Optimization: The widening gap between peak (Q4) and off-peak CPCs suggests potential value in shifting budget allocation to capture more impressions during lower-cost periods, particularly for non-seasonal products.
- Conversion Rate Optimization (CRO): With CPCs rising faster than CTRs, improving post-click conversion rates becomes increasingly critical to maintaining ROI. Investment in landing page optimization, user experience improvements, and checkout flow refinement can help offset rising acquisition costs.
- Strategic Bidding: Rather than bidding uniformly across products, advertisers should adopt more sophisticated approaches that allocate higher bids to high-margin products and customer segments with higher lifetime value.
- Quality Score Focus: As auction prices increase, the relative value of Quality Score improvements grows. Advertisers should prioritize ad relevance, landing page experience, and expected CTR to achieve discount factors on their actual CPCs.
Conclusion: Navigating the Future of Google Shopping Ads
Our analysis of Google Shopping Ads CPC trends from 2015 to 2024 reveals a clear pattern of sustained price increases across all ad networks, with particularly dramatic growth in Google Search CPCs. These increases have outpaced improvements in performance metrics like CTR, creating a challenging environment for advertisers seeking to maintain return on ad spend.
The introduction of new ad formats like Performance Max has provided temporary relief through more favorable efficiency ratios, but these advantages tend to erode as formats mature and competition increases. The widening gap between Google Search and alternative channels suggests opportunities for strategic reallocation, while increasing seasonal volatility highlights the importance of agile budget management.
Looking ahead, advertisers should anticipate continued CPC increases, particularly on high-commercial-intent placements like Google Search. Success will increasingly depend on sophisticated approaches to channel mix, conversion optimization, and bidding strategy. Those who can navigate these challenges effectively will maintain competitive advantage in an increasingly expensive digital advertising landscape.